[assembly: AssemblyTitle("ConsoleApplication1")]
[assembly: AssemblyDescription("")]
[assembly: AssemblyConfiguration("")]
[assembly: AssemblyCompany("")]
[assembly: AssemblyProduct("ConsoleApplication1")]
[assembly: AssemblyCopyright("Copyright 2009")]
[assembly: AssemblyTrademark("")]
[assembly: AssemblyCulture("")]
[assembly: ComVisible(false)]
[assembly: Guid("34ea927d-9b44-48c0-8d82-38d5a836c447")]
[assembly: AssemblyVersion("1.0.0.0")]
[assembly: AssemblyFileVersion("1.0.0.0")]

static void Main(string[] args)
{
Console.WriteLine("Hello World");
}
- Compiling in Debug mode
- Targetting Any CPU
- Framework 3.5
- Console Application
- Before comparison, I moved the assembly (exe) and pdb out of the bin/Debug directory into another directory.
So, easy enough to figure out, .Net embeds a timestamp in the dll of when it was built:
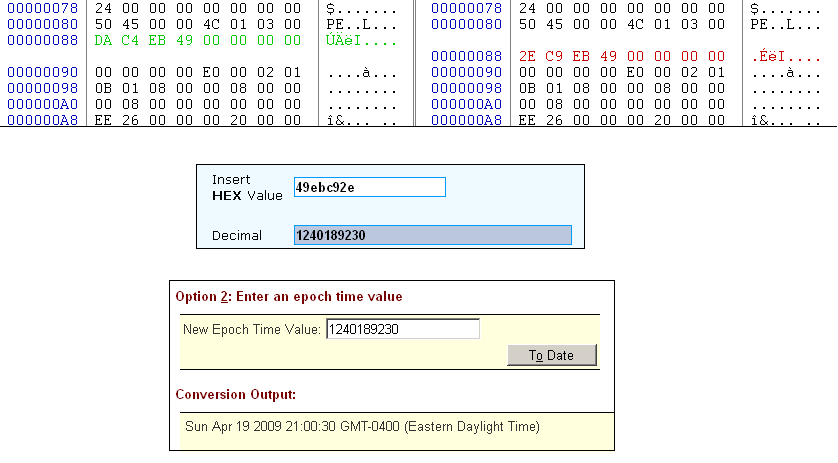
And of course every new build gets a seperate GUID. Here are the GUIDs in two different dll's:
And here is the left GUID in the corresponding PDB file.

The assmebly gets a GUID every time you build, which is matched in the PDB. So if you throw away the PDB, you can't ever debug that assembly . because no other PDB will ever match it... (except when that's not true. more notes on this later)
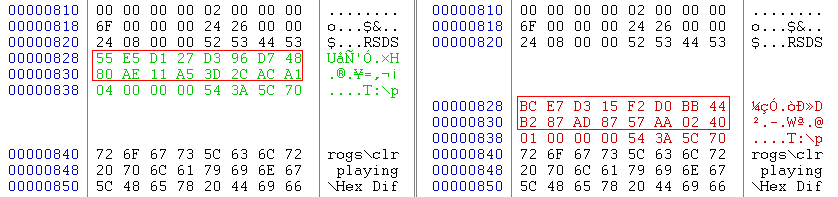
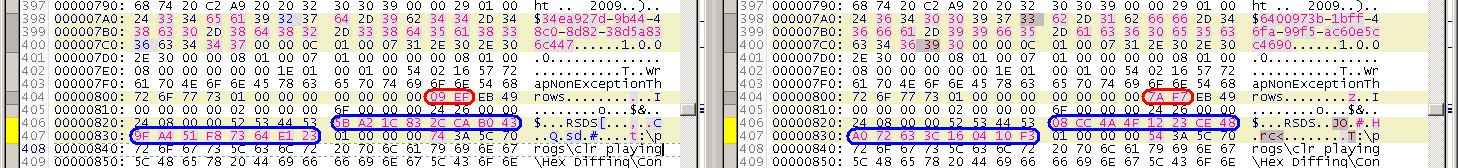
Right by the GUIDs I found a second timestamp, outlined here in blue:
Then I found the ModuleDef. It's an additional GUID that applies only to this assembly, this build. It changes every time, and it's purpose is to allow the assembly to be renamed by still keeping track of versioning info. (However, this is advised against.)
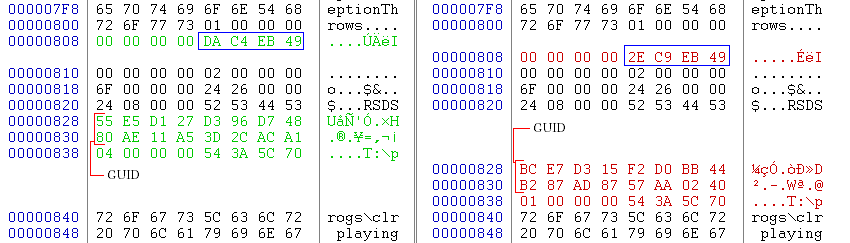
The final, most interesting part I found is a single byte shown in earlier photos but indicated here:
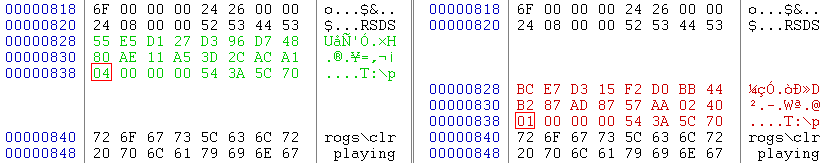
After playing around a little bit, I discovered that it incremented as I built the assembly multiple times in Visual Studio. It would sometimes reset to 1 however. If I issued a Rebuild or a Clean it would reset. However, closing Visual Studio and then reopening it did not reset it. A quick while loop and an rm while holding down F6 confirmed it has at least 2 bytes reserved for the purpose of this counter, and it seems likely all four bytes (the high two or three being 00's) are reserved for it. (I also switched to a different diff viewer because the first was giving me problems.)

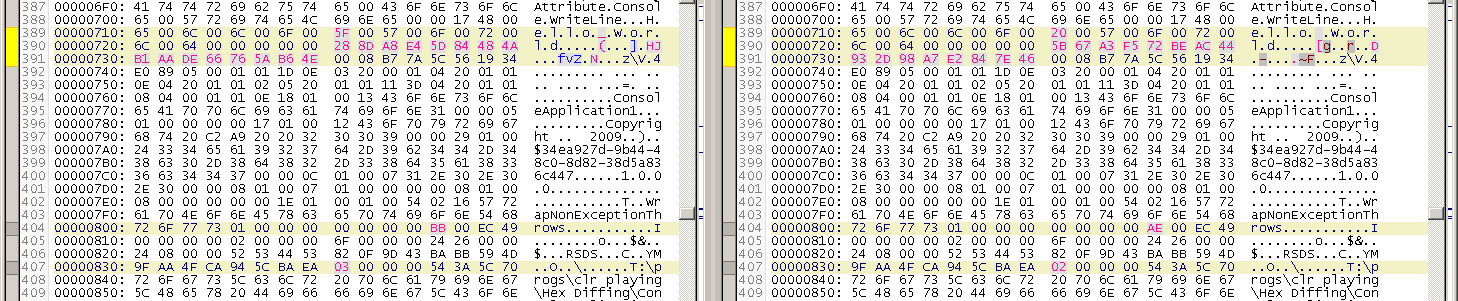
As I was messing around with this, I noticed something odd. Sometimes the PDB-GUID wouldn't change! Here you can see the 01 to 02 increment, and the timestamp, but the 16 bytes right before that single incrementing byte are the same!

I triggered a rebuild, which reset the counter, and the PDB-GUID did indeed change:

So I wanted to look into this, so the next step was take the most complex part of the equation out - Visual Studio. I want to know exactly what Visual Studio is doing when it's compiling them, and how it's different. I know the files aren't changing. Let's look at the commands it's running:
E:\WINDOWS\Microsoft.NET\Framework\v3.5\Csc.exe /noconfig /nowarn:1701,1702 /errorreport:prompt /warn:4
/define:DEBUG;TRACE /reference:"E:\Program Files (x86)\Reference
Assemblies\Microsoft\Framework\v3.5\System.Core.dll" /reference:"E:\Program Files (x86)\Reference
Assemblies\Microsoft\Framework\v3.5\System.Data.DataSetExtensions.dll"
/reference:E:\WINDOWS\Microsoft.NET\Framework\v2.0.50727\System.Data.dll
/reference:E:\WINDOWS\Microsoft.NET\Framework\v2.0.50727\System.dll
/reference:E:\WINDOWS\Microsoft.NET\Framework\v2.0.50727\System.Xml.dll /reference:"E:\Program Files
(x86)\Reference Assemblies\Microsoft\Framework\v3.5\System.Xml.Linq.dll" /debug+ /debug:full
/filealign:512 /optimize- /out:obj\Debug\ConsoleApplication1.exe /target:exe
Program.cs
Properties\AssemblyInfo.cs
That's a whole lot. And there's no difference between two consequtive runs. Nothing that indicates the counter should be incremented or anything! Not that I don't trust Visual Studio, but I went and ran this from the command line myself.
I immediately got suspicious because the exe and pdb outputting to a different directory. So VS was definely doing some shuffling behind my back. And I was right. VS is doing some funny stuff to keep the PDB and Assembly GUIDs the same. Here we can see that two subsequent runs from the command line will produce counters at 01 and different PDB-GUIDs.
 Later on, I'm going to have to look into what exactly Visual Studio is doing to keep that PDB the same while incrementing the counter...
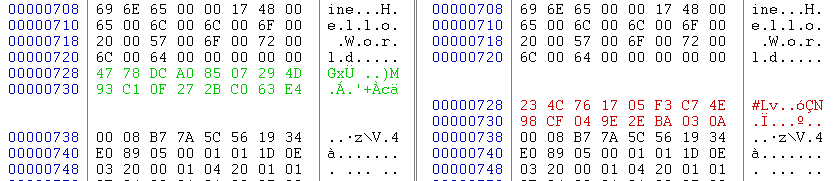
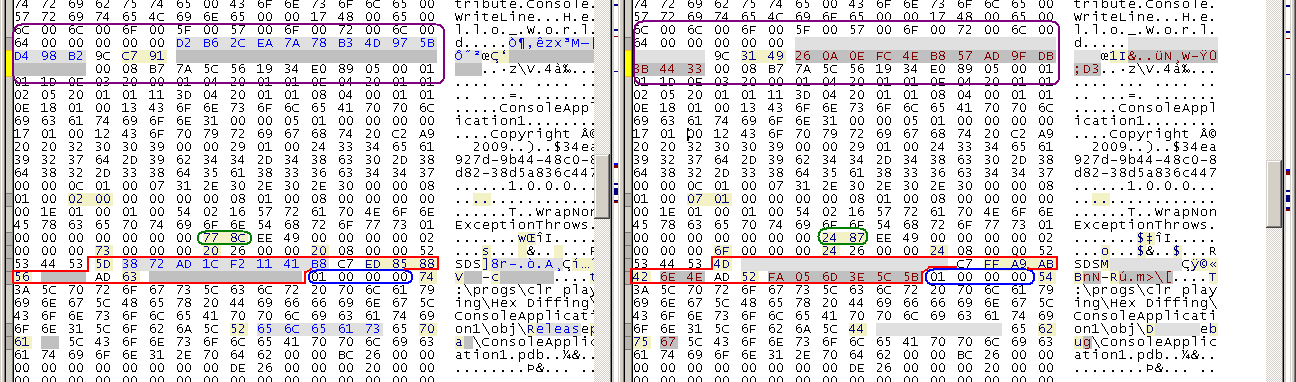
Moving on, the strangest part of all of this is that if you edit the source file, VS will not necessarily change the PDB-GUID. Here is a diff showing two different Hello World programs outputting slightly different string literals, but with the same PDB-GUID.
The string literal appears right before the strange 16 byte random value.
This is all interesting, but now I want to know how it works when you compile the program on a whole other machine! You can see some path information buried in the dll already, I want to see if anything else changes.
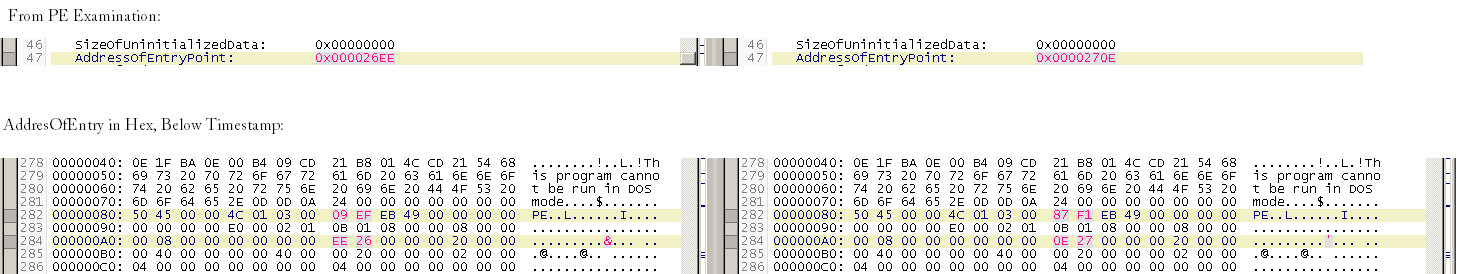
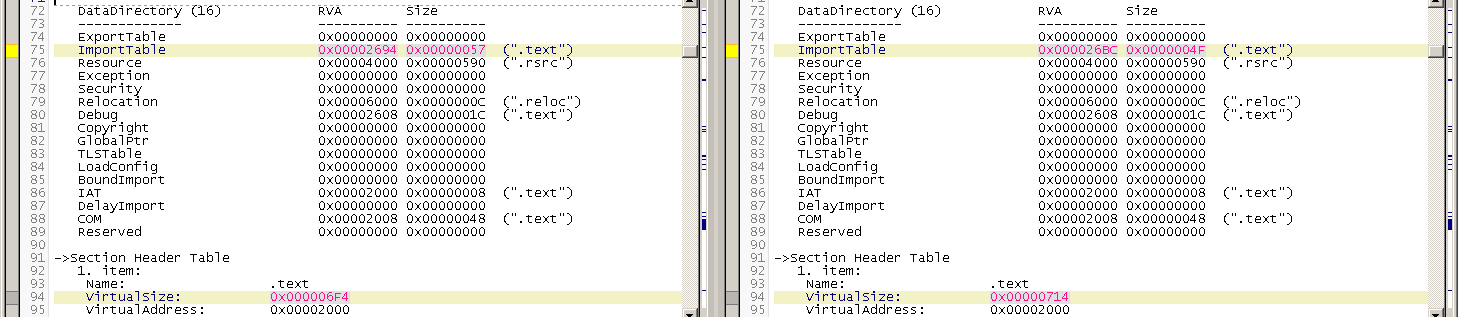
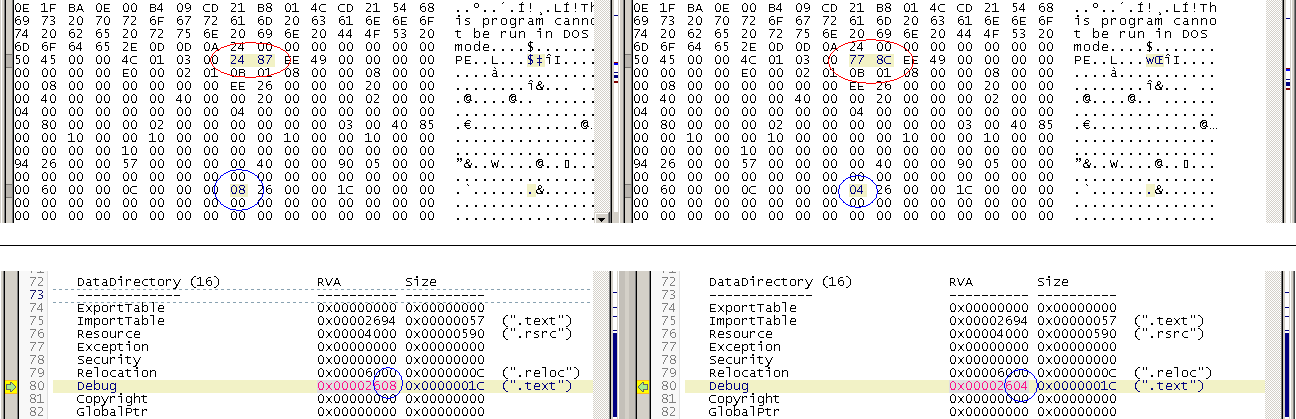
Because of differeing string literal sizes and some shuffing, the AddressOfEntryPoint changed in the PE Header, as well as some other information.
At this point I knew too much would be thrown off and I need to take string literals out of the equation. I whipped out the handy subst command and made my drive letters and directories line up. With the PE Headers in sync, I was in business to see the machine specific information embedded in these dll's. To help orient you, I've circled the PDB-GUID in blue, and the timestamp in red.
The bottom, single-byte change is the difference between a lowercase and capital T. The top change is also easy to figure out . that's the GUID for the assembly, from up top.
[assembly: Guid("34ea927d-9b44-48c0-8d82-38d5a836c447")]
It may be worth noting that if you do not specify this attribute, it is not added for you automatically.
I was almost expecting some sort of complication-operating system information to be embedded. The original compuer was running Windows x64 Pro while the second was running XP Home 32 bit. But every single difference was accounted for!
So every assembly has:
- A Timestamp, in two locations
- A GUID that matched the PDB
- What appears to be a completely random GUID generated every compile.
- A counter indicating what the build of the assembly is - generated only in subsequent Visual Studio builds.
But I wanted to know more. I wanted to know what the difference between Debug and Release mode is. Now part of release mode optimizes the IL, doing things like unrolling loops, inlining functions, hoisting, tail recursion, and others I'm sure. But this simplistic of a program doesn't have any optimizations. Now a recurring theme in this diff is offset problems. Due to string lengths (/Debug/ vs /Release/ for example) bytes would be offset and we wouldn't get a very telling diff. So I do a little behind-the-scenes futzing with string lengths to help things line up. And ultimately, there's not a whole lot, structure-wise, between Debug and Release for a program this small. Here we have the Timestamp, but more importantly we have a difference in the size of the first entire section.
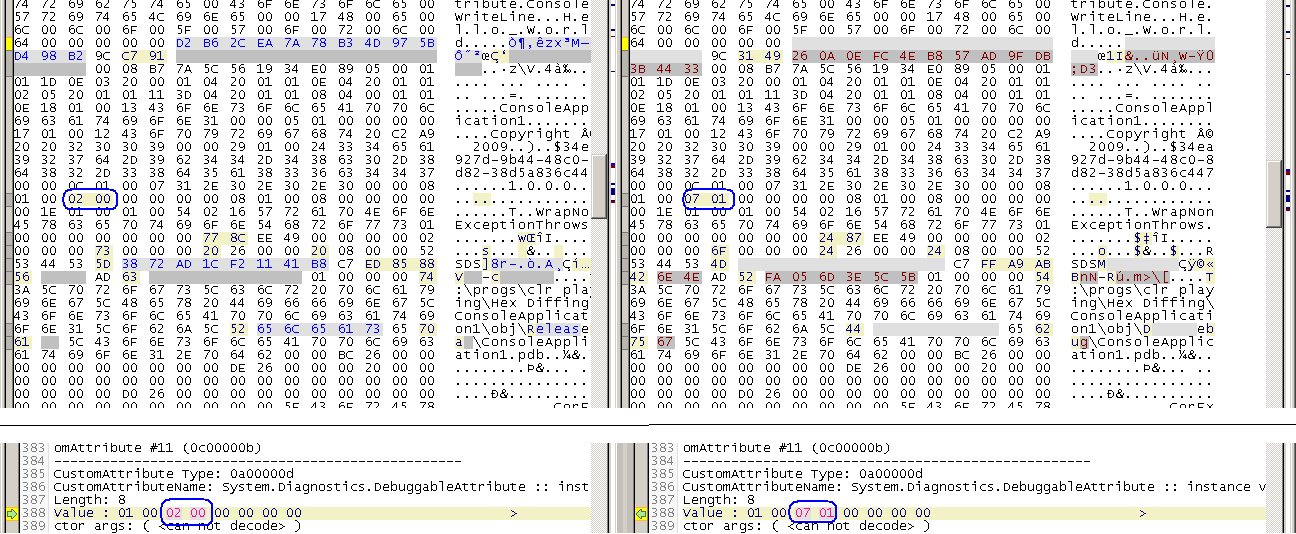
Let's look at the GUID Area. Here we can see the ModuleDef GUID at the top in purple, the timestamp in green, the PDB-GUID in red, and the counter in blue. There are a few other bytes hanging around that are different as well.
We can identify two of those bytes by diffing the generated IL from ILDasm . the 02 00 and 07 01 are values for the Debuggable Attribute.
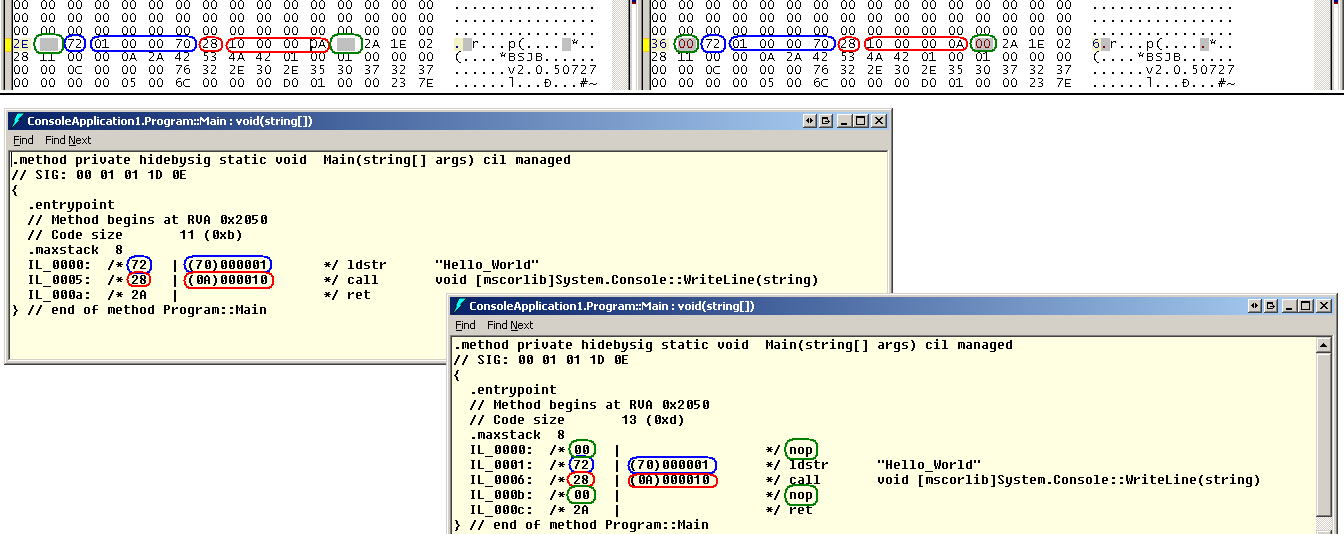
This is the really cool part - the actual instructions. We can identify missing 2 missing bytes by looking at the difference in the IL between the Debug (right) and Release (left). The Debug IL puts nops in at braces, so you can place breakpoints on them. The nops are missing in the Release version.
So we're basically done, right? Let's list all the diffs:
- Timestamp
- no-ops
- ModuleDef GUID
- Debug Attribute
- Second Timestamp
- PDB-GUID
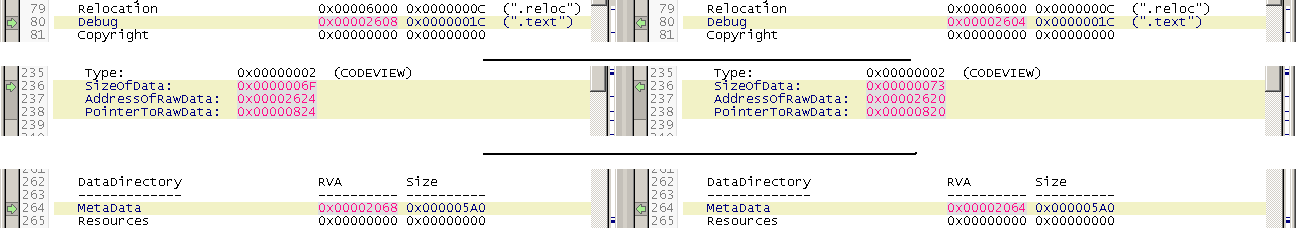
- Directory Difference
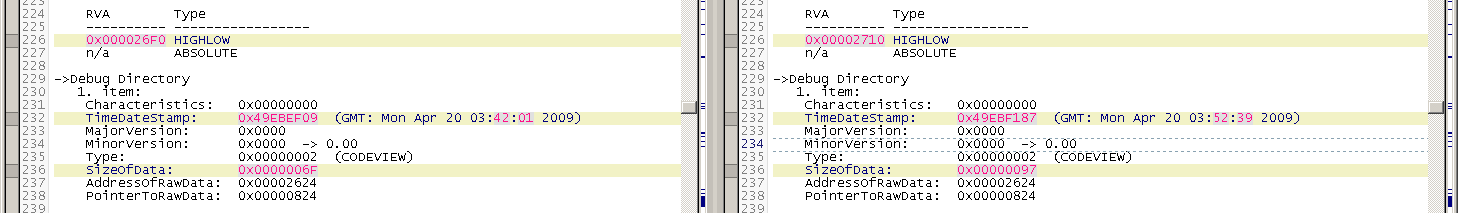
- Several 4 Byte Offsets (DataDirectory.Debug, SizeOFData, AddressOfRawData, PointerToRawData, DataDirectory.MetaData)
At this point you should be wondering about 4 byte offsets. We only had 2 bytes from nops! But all the offsets are 4 bytes:
And now you're going to get mad at me. Right here you can see two extraneous bytes in red. In blue are the no-ops from before.
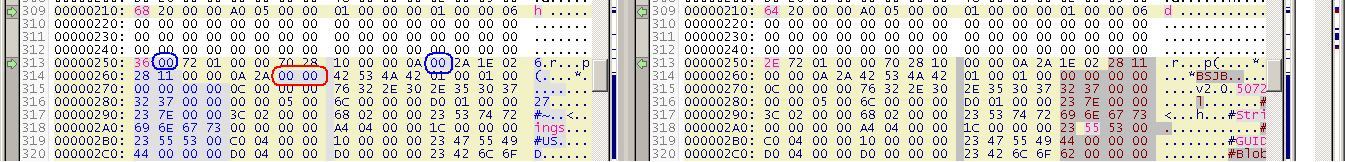
For all the other diffs above, I deleted those bytes. They were throwing everything off! I couldn't diff properly! I was pretty sure they were no-ops. But to verify that, I needed to figure out the bytes preceeding it.. I painfully searched each OpCode on MSDN and came up with this:
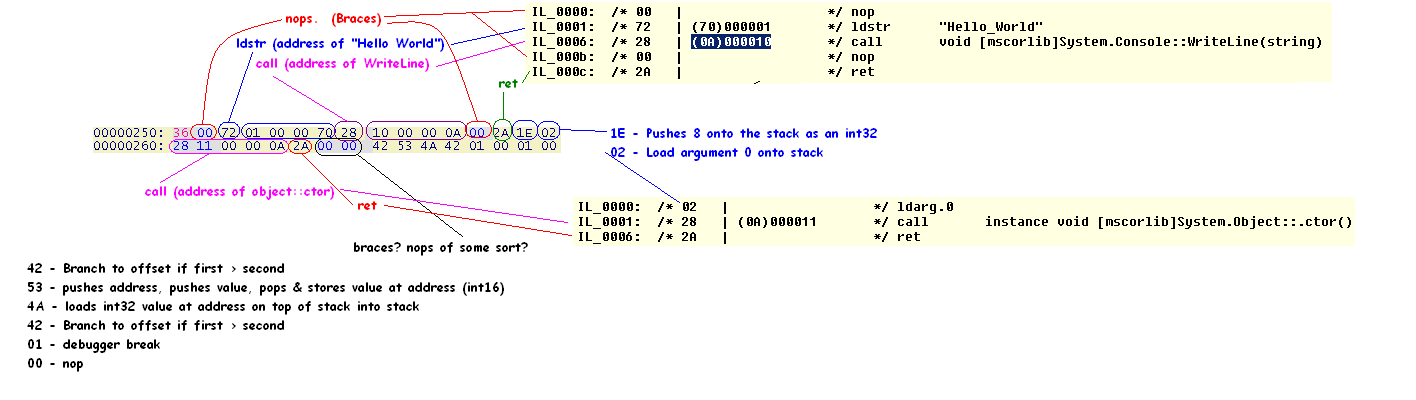
So the verdict I came up with, was that they were nops being inserted, probably for the compiler generated constructor of the Program class.
required, hidden, gravatared
required, markdown enabled (help)
* item 2
* item 3
are treated like code:
if 1 * 2 < 3:
    print "hello, world!"
are treated like code: